27 Sep
Did you meet your Break-even? What next step should you take? And most important, how to do break-even point calculation? Have such queries? Don’t worry; today we will solve all your doubts in this blog.
The Break-even point is a vital stage in a firm. It is a pathway of a good business plan as it helps the business to plan their cost structures such that they cover all their expenses.
We help your business grow with our specialized software that automates all the changes required. VISIT WEBSITE.
Table of Contents
What does the break-even point actually mean?
As the name says ‘even’, it refers to that level of output which evenly (or equally) breaks the costs and revenue. In simple words, it is that point of sale achieved when your total revenue becomes equal to your total expenses.
So, here we can say the Break-even (BE) point also as, Total sales = Total Cost.
For instance, assume that the total cost of a firm is Rs. 1000, and it makes sales of Rs. 1000 in a month. Therefore, it will be the Break-even point of the firm where they are having neither profit nor loss.
Hence, now we can say that Break-even is a level of sales in a firm where they are covering all their costs with no profit or loss. In other words, whatever they are investing, it returns to them through their sales.
Using this point, the firm decides whether or not they should raise their sales volume. At BE point, if the firm increases the sales, keeping the cost constant, it will gain profit. Whereas, if the firm decreases the sales, it’s going to bear loss because here total expenses become greater than the revenue. This makes sense because at BE point there was neither profit nor loss.
The Break-even point is also referred to as the critical point, equilibrium point, and balancing point.
Equation
Moving forward, if we want to state the break-even point in the form of an equation, we will have to take the help of marginal cost (cost per unit) for break-even point calculation.
Marginal Cost Equation
Basically, the marginal cost equation says,
Sales – Variable cost = fixed cost +/- Profit or loss
(here sales is the revenue at BE point)
Above we stated that the BE point is the one where neither profit nor loss is made, so here P/L (+/-Profit or loss) becomes zero. Therefore, if we derive sales (sales we are making at the BE point) from this equation,
Sales (revenue at BE point) = Fixed cost + Variable cost (as profit or loss is 0)
So, this becomes the formula for the firm to calculate the accurate sales made at the break-even point.
Break-even point calculation in ‘Terms’
Now, we will learn the methods of break-even point calculation. The break-even point can be calculated on the basis of three terms:
- Unit of sales volume – It refers to the number of units a firm should sell to attain the break-even point.
- Terms of money value – It refers to the amount of money a firm should spend on sales to attain the break-even point.
- Percentage (%) of estimated capacity – Here, we will compute using the terms of unit and the terms of money, and the answer will result in terms of percentage (%).
Therefore, we can calculate the BE point by using the above three methods.
1. Unit of sales volume
Moving further, break-even point calculation in the term of unit sales of volume can be done as:
Formula –
BEP unit = Fixed cost (Rs.) / contribution per unit (Rs.)
Here, contribution per cost = ‘selling price per unit – Variable cost per unit’
Therefore, through this formula, the firm can calculate the BEP in the terms of unit.
2. Terms of money
Now, break-even point calculation on the basis of terms of money can be stated as,
Formula –
BEP = Fixed cost / PV ratio
Here, PV ratio = Contribution / Sales
Therefore, the firm can attain the BEP in terms of money value using this formula.
Profit Volume (PV) Ratio
PV Ratio is also known as the marginal ratio or contribution ratio.
Formula –
PV Ratio = Contribution / Sales
Thus, the PV ratio basically expresses the relation between contributions with respect to sales. This is why; PV ratio also refers to as contribution ratio or C/S Ratio (Contribution / Sales).
3. Percentage (%) of estimated capacity
Withal, break-even point calculation on the basis of % of estimated capacity is done as,
Formula –
BEP (%) = Fixed cost / Total contribution*100
So, basically, now the firm can calculate BEP in terms of percentage using this formula.

These were the methods to calculate the break-even point in terms of unit, money, and percentage. These formulas are the basic ways to calculate. Yet, BEP can be derived using a graph too.
Break-even point calculation using the graphical method
The Break-even point can also be calculated on the graph. We can derive the BEP in terms of units sold as well as in terms of money through the graphical method of break-even point calculation. Now, as we know that there are three main components involved in the break-even point calculation.
- Fixed Cost
- Variable Cost
- Revenue
Before moving further, let us understand the components in brief and how they can be plotted on the graph.
Components –
1. Fixed Cost
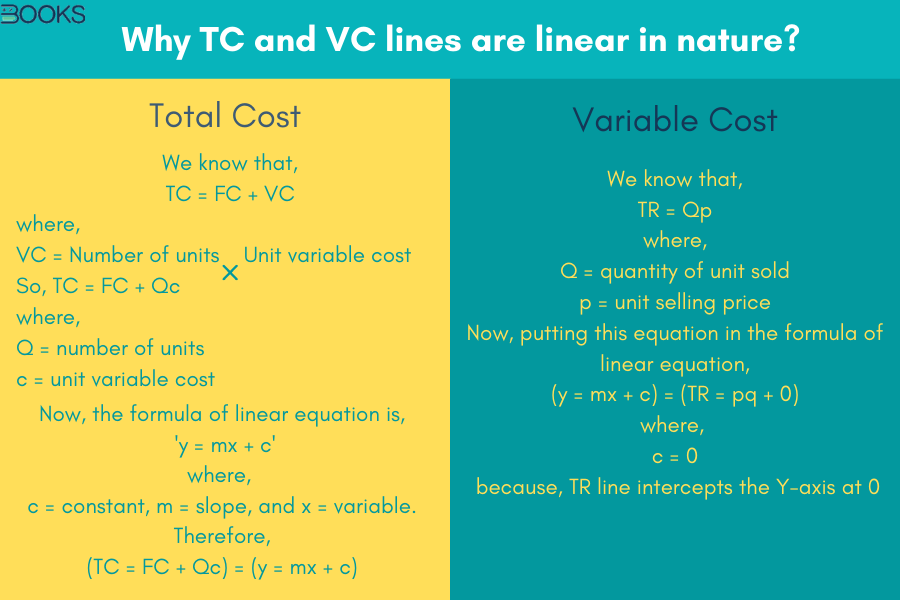
Fixed cost is the cost that does not vary with the volume of production. So, irrespective of the number of units sold, the fixed cost will remain constant throughout the production. So, on the graph, if we have to plot the line, it will be parallel to the X-axis. As a fact, the fixed cost can never be 0 even at 0 units produced. Therefore, it will never originate from zero.
2. Variable Cost
Variable cost is the cost that varies with the number of units sold. So, if we have to plot the variable cost on the graph, it will increase as unit quantity increases.
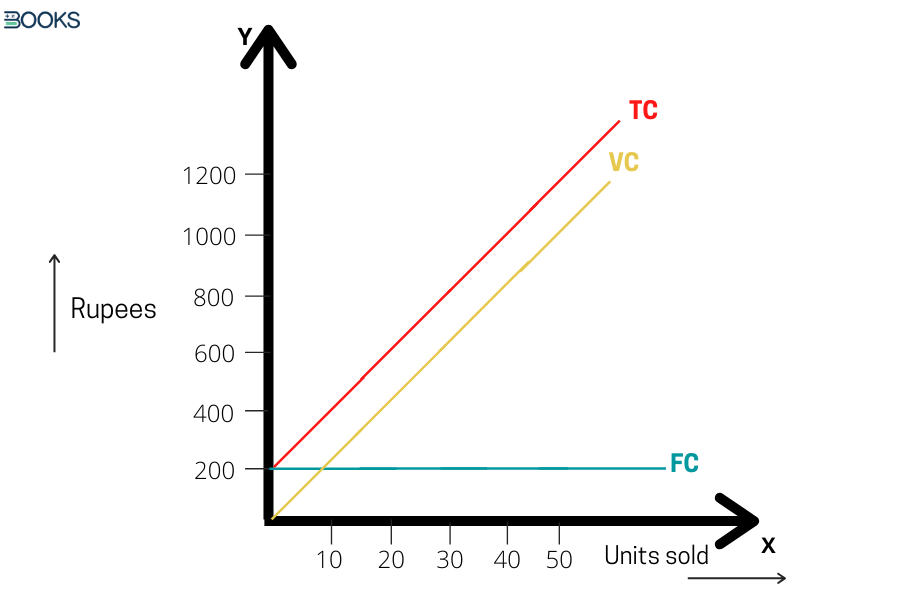
Note: – Now, if we add the Fixed cost and the Variable cost, we will get the Total Cost. Moreover, Total Cost (TC) can never be zero as it involves fixed costs also (that has to be incurred even though the production is on hold). So, on the graph, if we plot TC (sum of FC and VC), it will originate from the origin with FC and will be further parallel to VC.
3. Revenue
Revenue is the selling price per unit. For example, we say, you are selling 40 units at a selling price of Rs. 20 per unit. So, here the revenue will be:
Revenue = Rs.200 * 40 units = 800 Rs.
Therefore, in this way these three components can the plotted on the graph. Now, we know the basics! So moving forward, how can we derive the break-even point by these components on the graph?
Graphical representation
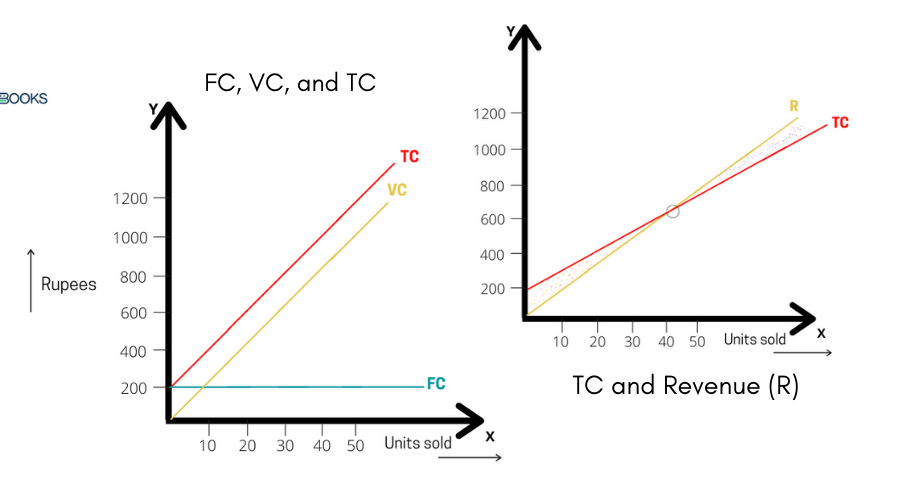
Here, we have plotted a graph with assumed numbers for your better understanding. The units sold are plotted on the X-axis whereas, the Rupees amount on the Y-axis.
As in the above graph,
- Fixed Cost (FC) being constant is parallel to the X-axis on Rs. 200 whereas,
- Variable Cost (VC) starting from the origin (0 units and 0 rupees moves straight as the amount of unit sales increases.
- The Total Cost (fixed cost + variable cost) is a straight line originating from Rs. 200 and 0 units sold and is further parallel to the variable cost.
- Lastly, the Revenue line is a straight line starting from 0 units sold and 0 rupees.
Now what mainly matters in Break-even point calculation is the Total Cost and the Total Revenue. The point at which the TC intersects with the Revenue (point ‘O’) is the ‘Break-Even Point’.
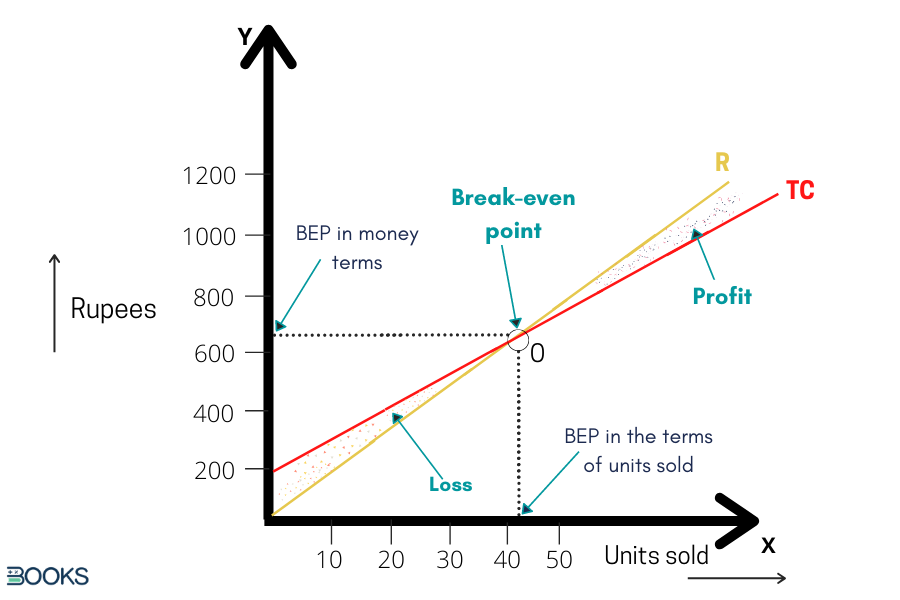
Now, if we draw a line parallel to the Y-axis touching the X-axis, we will get the number of units sold to attain the break-even point on the X-axis. And if we draw a line parallel to X-axis, touching the Y-axis, the point on Y-axis will represent the break-even point in terms of money or rupees.
Now the area (depicted as LOSS) below the break-even point represents the area of loss, while the region (depicted as PROFIT) above the break-even point represents the area of profit earned by the firm.
Therefore, the break-even points calculation can be made through graphs also.
Benefits of break-even point calculation
The break-even points calculation benefits the firm with various perks. Some of them are discussed below.
Profit Planning
The break-even points calculation in a firm helps to plan their profit. For a firm, planning their profits is one of the most effective tools in the hands of management. For instance, we can say, if the breakpoint is going higher, the chances of profit in the business drop. Therefore, the shorter the duration to reach the BEP, the more will be the profit.
Profit Improvement
The firm can improve its profit performance according to its break-even point calculation. They can increase the volumes sold or increase its selling price and decrease the variable cost or fixed cost accordingly to attain a sustainable position in the market and gain more profits.
Effective Control over Business Operations
The break-even analysis acts as a desktop tool for management in the firm. With the help of this, they can plan, control, and decide all of its business activities.
Helps to Estimate Contribution
Another benefit of break-even point calculation is that it helps the firm to get an idea of contribution needed, therefore, the difference between sales and variables to the profit-earning capacity of the firm. If we deduct the fixed expenses from the amount of contribution to a firm, the profit figures will be attained.
Margin of Safety
Using the break-even point calculation chart, we can easily know the margin of safety or requirement of inventory of the firm. The margin of safety can be computed by deducting breakeven sales from the actual sales. It plays a vital role and acts as an indicator to know how the margin can be increased. Also, the break-even point calculation helps the firm in inventory management.
The break-even concept is especially useful for planning and control because of its emphasis on the marginal concept. The utilization of break-even points emphasizes the effects of additional sales on profits.
Koontz and O’Donnell
How to use break-even point calculation?
A break-even point calculation permits you to ascertain your break-even point. But this isn’t the edge of your calculations. After you find the BEP, you should measure the number of sales to be made to reach the above break-even and gain profits.
At BEP point, you should first evaluate whether your ongoing plan is practical, or if you need to increase prices, realize a method to reduce costs, or maybe both. You should also note whether your products will be triumphant in the market. Only because the break-even point calculation found out the units of products you need to sell, doesn’t mean it will sell. Therefore, you should also focus on market strategies and consumer’s behavior.
As a fact, the break-even point calculation should be done before you set up your business. So, you can estimate the risk involved. In other words, you should oversee whether your business is worth it or not. Existing firms should determine this calculation before launching a new product or service to ascertain whether the probable profit is worth the startup costs or not.
However, you can use our Free and Ready-to-use tool to calculate your Breal-even point effectively here.
Uses in daily business operations
A break-even point calculation doesn’t only help you with startup planning. It also helps the business in their daily workings and planning as mentioned below:
1. Prices
If your break-even point calculation shows that your current profit is not good enough to meet your break-even point in the desired timeframe, then you can raise the price of the product. Yet, you must make sure that you are pricing your product under the market requirements and adjustable to its comparable products. Therefore, making sure that you don’t run out of the market.
2. Materials
You can control, plan, and maintain the costs of your product besides assuring its quality. This will help you to sustain the costs of materials and labor.
3. New products
The break-even point calculation allows you to evaluate the required fixed costs as well as variable costs before launching a product in the market.
4. Planning
When you already know at what level of output and expenses, you are going to attain break-even point, it becomes easier to plan long-term goals. For instance, if you want your business to grow and expand into a larger scale, you can ascertain how many sales you need to do to cover your new fixed costs.
5. Goals
With the help of break-even point calculation, you can easily estimate how many units you need to sell or how much money you need to make to break even in your firm. It can serve as an immensely inspiring tool for you and your team.
We hope now you understand what is the break-even point and how to calculate it. If you still have any queries, you can share it with us below in the comment section.
